Since 15 March, strong winds have been blowing in the Sahara Desert in Africa, and violent sandstorms have hit not only Spain, Portugal, France, Switzerland and other places, but even the more northern United Kingdom. Under the influence of the air currents, many cities experienced red rain and the air was heavily polluted by sand and dust. As a result, particle size distribution in Europe can vary from place to place. The particle monitoring specialist Palas® offers solutions for monitoring air quality. With the air quality monitor AQ Guard, dust particle size can be monitored and accurate and stable measurement results can be obtained.

Consequences of the Sandstorm Hazard
The Spanish Meteorological Service said that in the area affected by the dust storm, inhalable fine dust particles in the atmosphere have increased and air pollution has risen. Dust falling on glaciers will accelerate their melting, and covering plant leaves will affect photosynthesis, reduce crop yields and harm people’s health. Due to the fluidity of sand and dust, a large amount of sand and dust particles are transferred over a wide area. While suspended in the air, these dusts continue to accumulate and transport microorganisms, heavy metals, pesticides and other harmful chemical pollutants into the environment. They spread allergens, bacteria and viruses wherever they go and can penetrate through the protective layers into people’s mouths, noses, eyes and ears, increasing the risk of respiratory diseases and allergies.

Fig 1:Sahara dust contains very coarse-grained particles, as the electron micrograph shows
Palas® Solutions
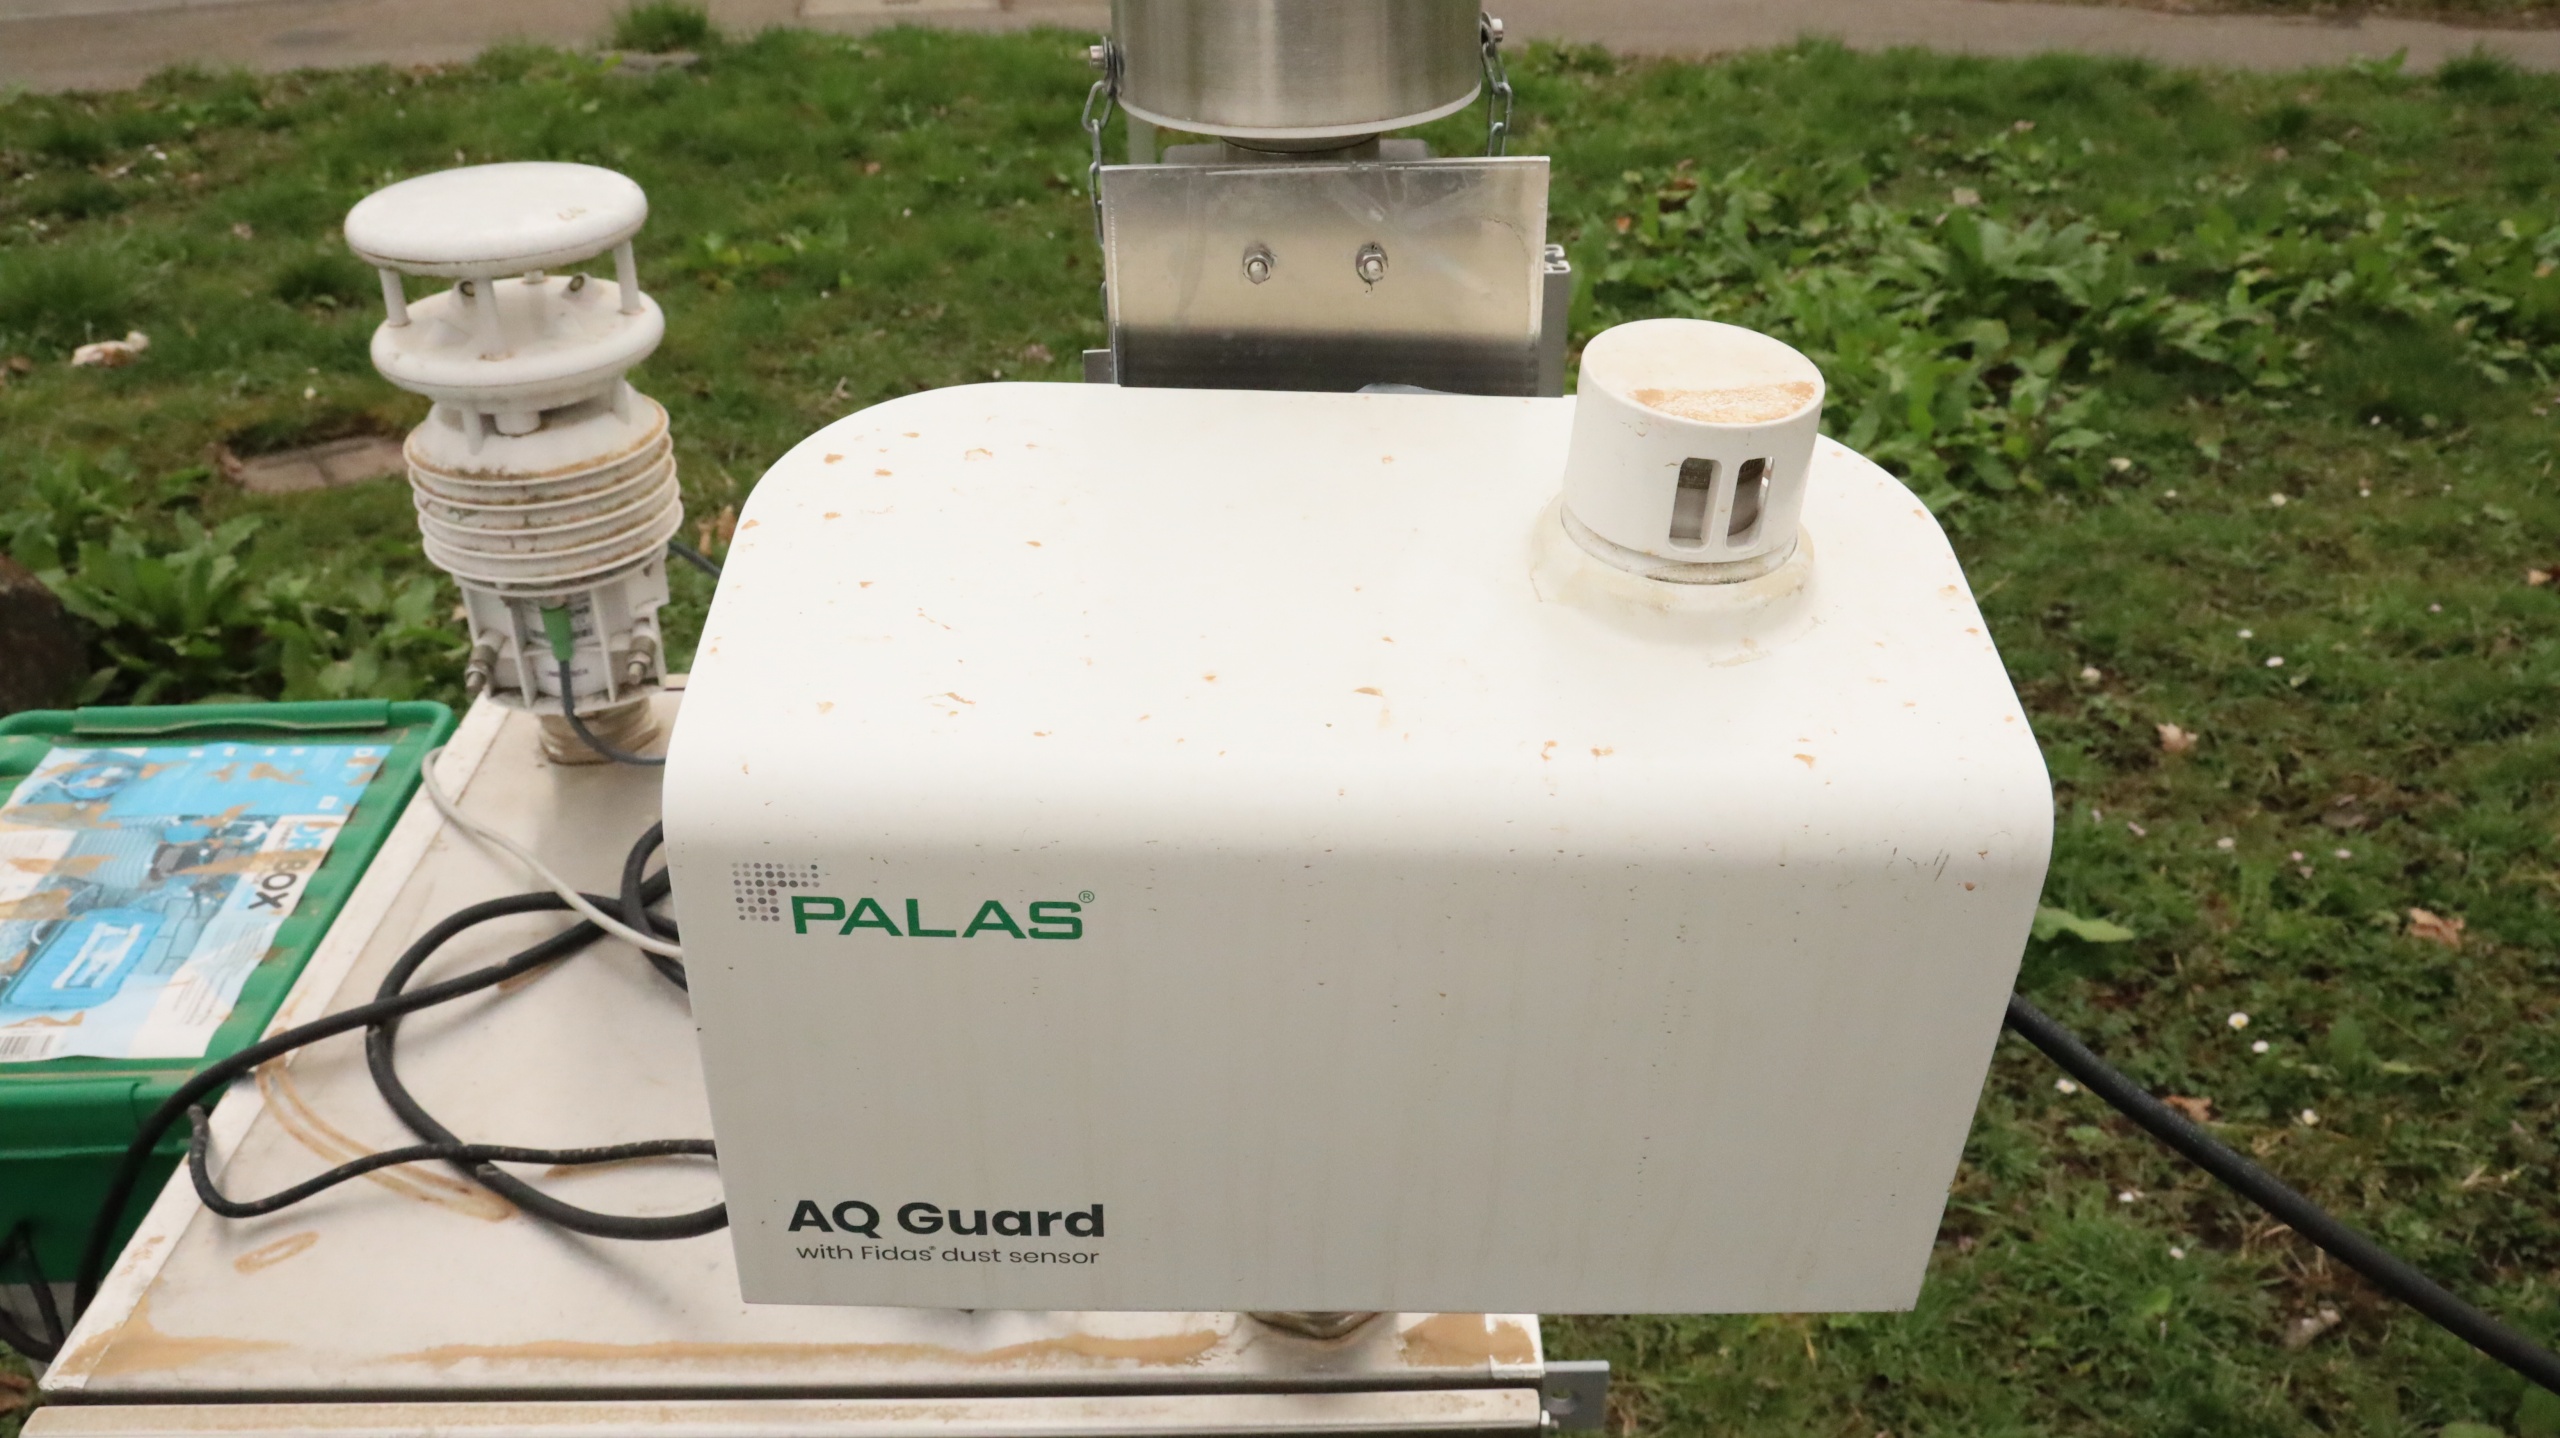
Most of the Saharan dust is washed away by rainfall as precipitation. The reason for the red rain is the reddish particles shown in Fig. 1, which are due to the high iron oxide content of the particles. The measured particle size is in the range of 1-10 µm. Since the residence time of the coarse particle size in the aerosol state is not long, an accurate instrument is required for the measurement. This is also reflected in the measured size distributions on the AQ Guard monitors. Below is an example of three size distributions measured in Karlsruhe (Fig. 2 and Fig. 3).

Fig 2:AQ Guard at Palas Karlsruhe headquarters (Germany) with clear deposits

Fig 3: Size distributions measured at the Karlsruhe site
The blue curve shows a distribution shortly before the event. The green and red curves show the size distributions at the time of the Sahara dust event. They differ depending on the weather conditions. If there is simultaneous precipitation (green curve), for example, the distribution is increased overall, but only in the range < 1 µm. The red curve shows a distribution typical for Saharan dust with an increased proportion in the range 1-10 µm. On the long way from the Sahara via southern Europe to northern Europe, the Saharan dust and aerosol size distribution changes depending on local weather conditions.
The size distributions over Europe can therefore vary locally, but are very well resolved by the size-resolved measurement with the aerosol spectrometers of the AQ Guard fine dust systems.
Technical principle
AQ Guard, the advanced compact analyser for determining indoor air quality, continuously and reliably analyses airborne fine dust particles in the range from 175 nm to 20µm. A newly developed single particle aerosol distribution spectrometer (SPADS) calculates the fine dust values based on optical single particle light scattering, taking into account signal duration and shape. The sensor system and algorithms were developed based on the technology of the EN 16450 certified Fidas® 200. The ambient version achieves an accuracy comparable to type-approved analysers, which sets the AQ Guard apart from similar devices.
Palas® will soon be launching the new AQ Guard smart, stay tuned!
AQ Guard smart

Advantages
· High accuracy and reproducibility of the fine dust values due to the technology based on the certified Fidas® 200 series; known for its proven quick and easy on-site calibration
· Short-term commissioning and immediate recording of measured values via the cloud MyAtmosphere
· Situation-specific configuration via Wi-Fi hotspot, remote access and external touchpad
· Communication over GPRS/3G/4G/Ethernet/Wi-Fi, optional: LoRaWAN
· Expandable with weather station and gas sensors for better assessment and evaluation of particulate matter data
· Measurement of Cn, PM1 , PM2.5, PM4, PM10 with high temporal resolution (optional: SO2, CO, NO2, O3)
· Particle measurement range from 0.175 – 20,000 nm up to 100 mg/m³ mass concentration or 20,000 particle/cm³ (single particle analysis)
Applications
· Rodas, pails, ports
· Smart city projects
· Open pit mining, landfills
· Construction sites: roads, railways, demolition sites
· Industry: production processes, bulk material handling (mixing, discharge, storage, packaging, etc.), border control
· Inner city
Palas® China will arrange a series of online webinars both in English and Chinese for Ambient air quality continuous monitoring system, Palas® SMPS scanning mobility particle sizer, Palas® Promo® & Aerosol Generator & Dilution system, ISO 16890 filter media tester, Palas® MFP 3000 G, ISO 29463-3 filter media tester, Palas® MFP Nano plus 4000, ISO 17536 Fractional filtration efficiency tester of Oil Mist Separator, Palas® HMT 1000, as well as Particle Distribution Measurement Devices Introduction – Optical Scattering Method and many other solutions. If interested in the webinars for our products, you are more than welcome to register on our official website and get the latest webinar plan!

