Description
Dust measuring device for characterization and comparison of the dust formation of powders and bulk materials
Dust is generated during the production, conveyance, and filling of powders, bulk materials, granulates, pellets, etc. This dust can have negative impacts on occupational safety and the reliability of production. In addition, dust pollutes the environment and is not inconsiderable in the loss of production.The first essential step in preventing unwanted dust is to measure dust formation following free fall and impact.The DustView II is a fully automated dust measurement system that enables rapid and precise measurement of even the smallest fractions of dust generated following free fall and impact.Using the DustView II, the individual dust formation behavior can be determined quickly, clearly, and reproducibly so that the application of the system, especially in the quality assurance of powders, is outstandingly possible.
Norms and certificates
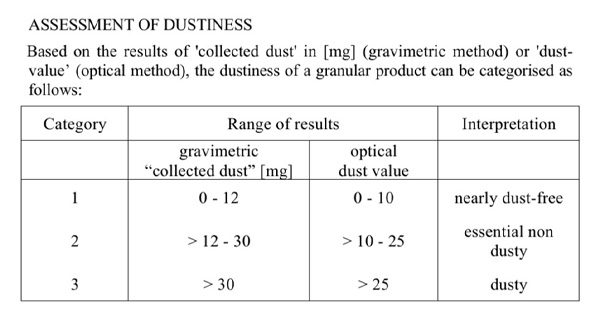
For dust assessment of granular products, the international standard CIPAC MT 171.1 defines the “Dust Value” classification based on optical measurement:
Source: CIPAC MT 171.1
According to the standard:
- – Dust Value 0–10: Category 1, Nearly Dust-free.
- – Dust Value >10–25: Category 2, Essentially Non-dusty.
- – Dust Value >25: Category 3, Dusty.
Operation principle
Characterization and comparison of the dust formation
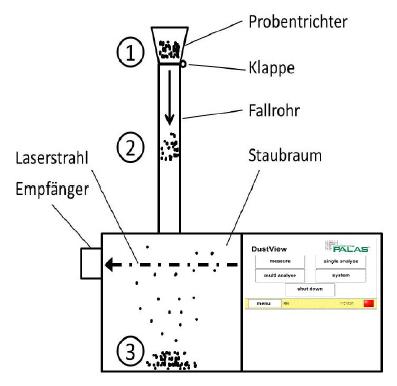
Fig. 1: Schematic design of the DustView II
The sample (typically 30 g bulk material) is poured into the sample funnel. At the start of he measurement, the valve opens automatically, and a sample falls into the dust reservoir. The Measurement begins immediately after the valve opens.
The dust is dispersed in the reservoir. The resulting dust development causes an attenuation of the laser beam (extinction measurement). This attenuation is observed during measurement and classified as a dust value between 0 and 100 (0 = No attenuation of the laser beam due to dust development, i.e., there are only minor dust fractions in the reservoir, 100 = Complete attenuation of the laser beam due to dust development.)The dust values change over time and indicate the attenuation of the laser beam in relation to the 0 value (= no attenuation). The 0 value is automatically determined without dust before each measurement (calibration). At the end of the measurement, the data is automatically stored.
The dust number (STZ) consists of the maximum dust value and the dust value indicated 30 seconds after the maximum dust value has been reached:
Dust number (STZ) = Max. value + 30-s value
Comparison measurements
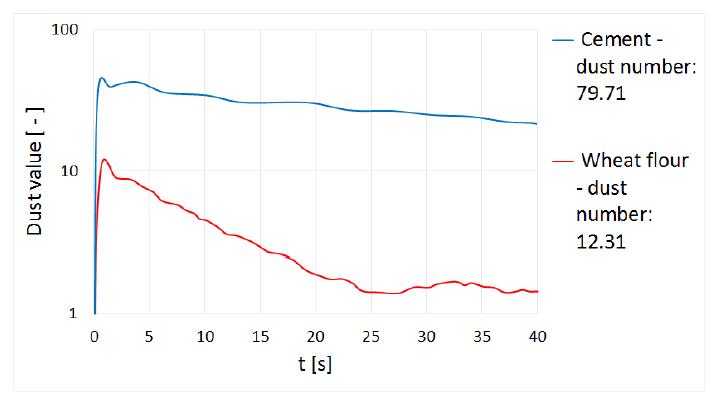
Fig. 2: Comparison of two bulk materials
Due to its finer particle size distribution and the material’s specific characteristics, the cement sample clearly generates more dust than the wheat flour sample. Wheat flour contains considerably larger particles that quickly settle to the bottom of the reservoir. In comparison, nearly all finer cement particles remain in the air even after 30 s.
These comparisons enable a product to be quickly and verifiably optimized concerning dust behavior.
The high reproducibility of these measurements enables easy and economical production controls of bulk materials.
Extensions/Accessories
Following completion of the measurement, the results are displayed directly on the device and are shown as numerical values and in the form of a chronological sequence. Automatic storage of the results enables the analysis of earlier measurements without an additional PC.
The system allows the creation of reports as a PDF or text file. In addition, a report can be printed out immediately using a printer.
In addition to analyzing individual measurements, the DustView II firmware enables comparing up to ten measurements. The report creation options mentioned above are also available here.
Multiple measurements can also be averaged easily and quickly using the series measurement option.
Evaluation software for the analysis of measurements on an external PC is also included.
The DustView II measurement device was developed during the AIF Pro INNO II Research project (KF 0295803WZ8) in cooperation with the Bergischen Universität Wuppertal, Prof.-Dr. E. Schmidt during the time 2008 and 2010.