Description
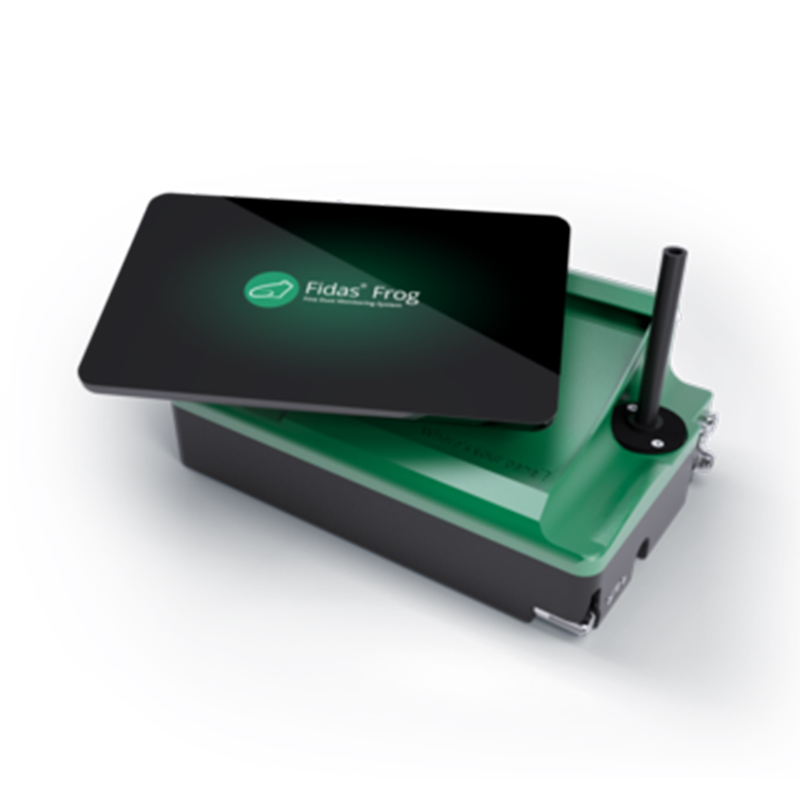
The fine dust measurement device Fidas® Frog allows for a fast, reliable and quality-assured determination of fine dust e.g. monitoring within the scope of Health, Safety and Environment (HSE) management at workplaces (exposure assessment) or in the range of indoor air quality measurements (e.g. for offices, public buildings such as schools, passenger compartments…) .
It measures simultaneously the environmentally relevant mass fractions PM1 , PM2.5, PM4, PM10, TSP as well as the particle number and the particle size distribution within the particle size range of 0.18 – 100 µm. By providing fine dust values with high time resolution, the operator receives comprehensive information for evaluation and assessment of the fine dust pollution for the investigated application.
The very compact and light design as a portable hand-held monitor with either battery or mains power operation as well as the operation time of up to 8 hours per battery charge, allow for a flexible application of the Fidas® Frog at any measurement sites.


Fig. 1: Fidas® Frog
Fidas® Frog communicates via WLAN with its wireless operator´s panel (Tablet). By this it is possible to perform measurements with a distance between the measurement site itself and the operator of the Fidas® Frog, e.g. for sites difficult to access. This concept furthermore allows for the integration of one or more Fidas® Frog in an existing network and the control of the connected devices from one central PC, e.g. for area-wide monitoring of a production facility.
Fidas® Frog uses the recognized measurement technology of optical light scattering of single particles and is equipped with a LED light source with high intensity (dp min = 180 nm), highly stable output and long lifetime. The sensor and the evaluation routines of the Fidas® Frog are also used in the Fidas® 200, which is certified for monitoring of PM2.5 and PM10 in ambient air by TÜV/Umweltbundesamt and which have been validated in comprehensive comparison campaigns versus the gravimetric reference method. By implementing this well-approved technique and by the numerous measures for quality assurances during the production (e.g. comparison of each Fidas® Frog with a certified Fidas® 200), precise and quality-assured measurements can be ensured.
The calibration of the system can be checked and adjusted, if necessary, easily and quickly also under field conditions on site at any time with the help of a monodisperse test powder.
Fidas® Frog operates with a volume flow of 1.4 l/min and is equipped with sensors for environmental conditions, temperature, atmospheric pressure and relative humidity.
Principle of measurement
The actual aerosol sensor is an optical aerosol spectrometer that determines the particle size using Lorenz‐Mie scattered light analysis of single particles. The single particles move through an optically differentiated measurement volume that is homogeneously illuminated with white light. Each particle generates a scattered light impulse that is detected at an angle of 85° to 95° degrees. The particle number is measured based on the number of scattered light impulses. The level of the scattered light impulse is a measure of the particle size diameter.
The lower detection limit for immission measurement was able to be reduced to 180 nm through improved optics, higher light density using a new white LED as the light source, and improved signal analysis (logarithmic analog digital converter). This enables greatly improved detection, especially of smaller particles, which are mainly found at high concentrations near roadsides (see Fig. 2).

Fig. 2: Higher sensitivity with the Fidas® fine dust measurement system for the 0.18 – 18 µm particle size range
The better the classification accuracy and the resolution capacity, the more accurate the definition of the particle size distribution.
Using a white light source enables a precise and unambiguous calibration curve to be obtained, resulting in an extremely high size resolution. The patented T-stop provides a precisely defined optical measurement volume and enables particle measurement without border-zone errors, resulting in a precise size measurement. The new digitized electronic signal analysis system enables the rapid identification and correction of coincidence, as necessary.

Fig. 3: Comparison of the algorithms for conversion of the particle size distribution by PM values
In order to convert the measured values into a mass or mass fraction, the high-resolution particle size distribution in each value is multiplied by a correlation factor that reflects the different sources (e.g. combustion aerosols, tire wear, pollen) of the environmental aerosol (see Fig. 3). A mass fraction is obtained by additionally applying the separation curve to the determined particle size distribution. Multiple separation curves can be used simultaneously for the same size distribution, which enables the simultaneous output of PM10, PM2.5, PM1 (and others). For example the Fidas® Frog can be operated with the same conversion algorithm, which has also been implemented in the type-approved and certified ambient air monitoring system Fidas® 200 for regulatory monitoring of ambient PM2.5 and PM10 concentrations.
Operation
The operation of the Fidas® Frog is intuitive and simple. With the operator interface, all measured data can be evaluated and compared directly. Already during the measurement, messages on exceeded limit values are possible. These limit values can be defined either based on legal requirements or on individual needs (see limit values in fig. 4).
Fig. 4: Display of measured values during a measurement
An integrated camera is documenting the measurement set-up. By this pictures can be added for documentation directly and in a comfortable way to the measured data set or the measurement report in pdf, generated by the device itself. Fig. 5 shows such a measurement report in pdf including data of the measurement conditions saved by the user and graphical evaluation of the measurement data. Pictures of a workplace measurement have exemplarily been attached to this measurement report as well.
Fig. 5: Example for a measurement report (page 1 and 2)
The measured data can either directly be printed or transfered to an USB-stick via the micro-USB-port and be processed on an external PC. In this case, the evaluation software PDAnalyze Fidas® offers various data evaluations especially for the particle size distribution and it offers possibilities for export.


