Description

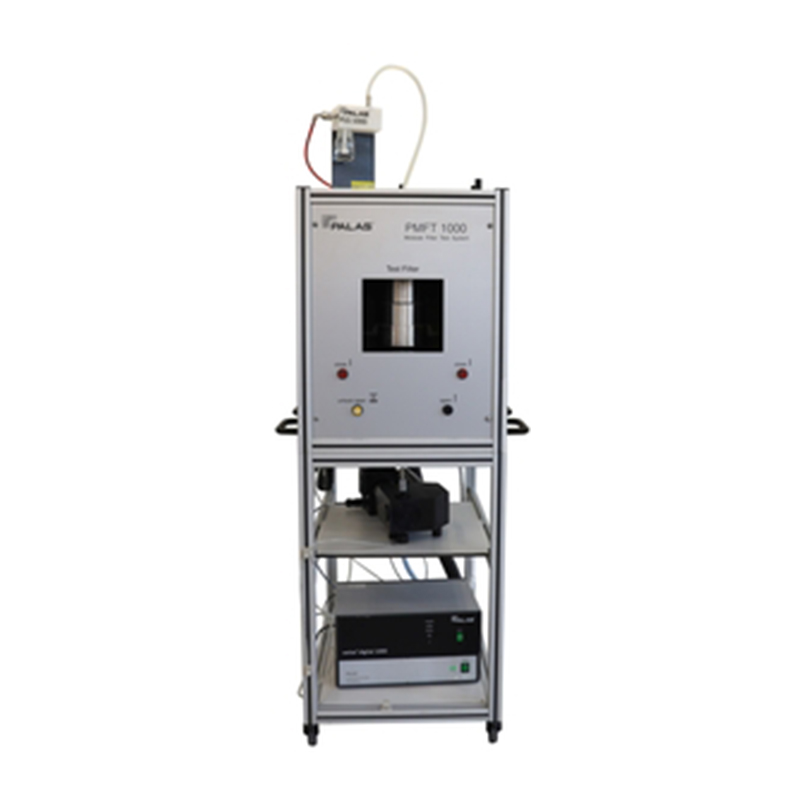
Fig. 1: MFP 3000 FTP
The MFP 3000 FTD filter test rig comprises the test rig MFP 3000 with a test surface of 100 cm2 and the additional conduit FTD 3000 with a test surface of 400 cm2, which can be operated in turn.
The MFP 3000 FTD operates in suction mode. This ensures a particularly uniform formation of the dust cake even at high inflow speeds.
Our quality in detail
1. Variable aerosol generation Thanks to the use of different dispersers for dusts, KCl/ NaCl, DEHS etc.; shortened measurement times are possible e.g. through increased dust concentration
2. Mixed air, adjustable for inflow speeds from 2 to 20 cm/s (FTD 3000); optional: transient inflow
3. Light scattering spectrometer Promo® 3000 for clear particle measurements in high concentrations of up to 5000 mg/m3 (SAE Fine) and low concentrations for the determination of the initial fraction separation efficiency
4. Clean gas sensor
5. Raw gas sensor
6. Mobile pneumatic filter holder for fast removal and loading of the test rig: 400 cm2 for the FTD 3000
7. Gravimetric filter holder for simple and fast evaluation of the gravimetric separation efficiency
Automation
The MFP 3000 has an integrated mass flow controller that it uses to control the volume flow. The volume flow rates are automatically monitored and controlled by the FTControl filter test software. The data from the integrated sensors – such as the volume flow, temperature, relative humidity and differential pressure at the filter – are also recorded automatically during the filter test.
Measurement of the fraction separation efficiency

Fig. 3: Example: Comparison of fraction separation efficiencies
• Fully-automated measurement of the fraction separation efficiency
• Clear demonstration of the separation efficiency of your filter medium throughout the entire measurement range from 0.2 to 40 µm with the Promo® system
• Highest measurement reproducibility and repeatability highlight even fine differences in the separation efficiency
• Short measurement times of around 2 minutes per separation efficiency measurement thanks to optimized aerosol application
• Simple comparison of separation efficiency curves, calculation of mean values also possible
Sampling and layout
The vertical layout allows even large particles (up to 40 µm) to make their way onto the filter medium. On the raw and clean gas side, isokinetic sampling probes are provided for the raw and clean gas sensor.
Burden / hold time measurement and record of the pressure loss curve

Fig. 4: Example: Hold time measurement
• Performance of measurements of the fraction separation efficiency during dust application; pressure loss or measurement time can be pre-selected as the abort criterion
• Pre-selectable burden application steps in relation to pressure loss or time
• Gravimetric determination of the separation efficiency
• Determination and display of the pressure loss curve and retention curve in diagram and table form; the representation of the particle diameters at 80% and 90% separation efficiency provides additional information
• Comparison of the fraction separation efficiencies during the different burdening steps
• Shortening of the measurement times, e.g. through increased aerosol concentration